What are Individuals Chart with Moving Ranges
In some cases, it is necessary for process control to be based on individual readings, rather than subgroups. This typically occurs when the measurements are expensive — such as in destructive testing — or when the output at any point is relatively homogeneous — the pH of a chemical solution, for example. In these cases, control charts for individuals can be constructed as described below. However, four cautions should be noted:
1) Charts for individuals are not as sensitive to process changes as x̄ & R charts.
2) Charts for individuals must be carefully interpreted if the process distribution is not symmetrical.
3) Charts for individuals do not isolate the piece-to-piece repeatability of the process. In many applications, it may be better to use conventional x̄ & R charts with small subgroup sample sizes (two to three), even if this requires a longer period between subgroups.
4) Since charts for individuals show only one sample per subgroup, values for x̄ & ˆσ can have substantial variability (even if the process is in control) until the number of subgroups is 100 or greater.
Steps for Creating an Individuals Chart with Moving Range
1) Select the key variable to monitor.
2) Record individual readings on an individual’s control chart.
3) Calculate the moving range between individuals. It is generally best to record the difference between each successive pair of readings — the difference between the first and second reading, the second and third, etc. There will be one less range than there are individual readings — 25 readings give 24 ranges. In some cases, the range can be based on a larger moving group — threes or fours, or on a fixed subgroup, like all readings taken on a single shift. Even though the measurements are sampled individually, it is the moving range group size that determines the sample size “n” for calculating control limits. Continuing with the example above, n = 2, not 1.
4) Calculate x̄ & R 5. When calculating R5 there is one less range value than the number of individual readings.
5) Calculate control limits using the following formulas:
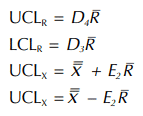
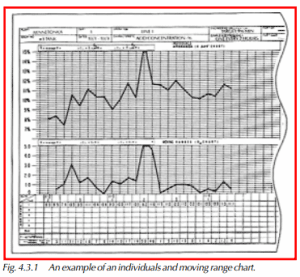
There is no lower control limit for ranges for sample sizes below seven. For a sample of an Individuals Chart with Moving Range, see Figure 4.3.1.