What is Spc At The Operator Level
Most data collectors, such as the DataMyte 953, are designed for production-oriented SPC. Data collectors add capabilities for memory, statistical reporting, and direct computer interfacing to gauges applied at the process.
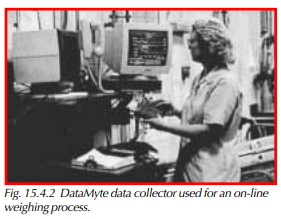
At stations throughout a plant, operators can use gauging with electronic output to record measurements in the data collector. As many as 90 characteristics per part can be monitored at any one time. Measurement is fast, resolution is maintained, and data are automatically placed in subgroups logged with time and date of collection.
Although a typical data collector connects to many different gauges for automatic data collection, the keyboard on the unit also can be used to enter data manually. The operator enters process specifications, and the data collector alerts the operator if any reading is outside specs.
In addition, process control limits and reasonable limits (gauge range) can be entered. If a subgroup of data lies outside the process control limits, the operator is alerted immediately.
The data collector also lets you label collected data. For example, a label may be assigned to data indicating the particular machine, operator, and/or shift involved. This capability proves valuable during later analysis of data, and in identifying the capabilities of particular shifts or machines.
Producing Control Charts
To create a control chart in a data collector, first you specify the sizes of the subgroups. Then you record data in each subgroup, and each becomes a point on a chart.
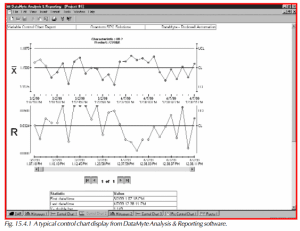
For an X-bar and R chart, the data collector calculates the average and range of each subgroup and plots them. You can then calculate control limits, and include them on the chart after one subgroup of data has been collected. Most statisticians recommend, though, that you collect a minimum of 20 subgroups before you calculate control limits.
The data collector displays control charts on a monitor, on an LCD screen, or prints them out on a printer. Although paper control charts provide good permanent records, they are not the most efficient vehicle for data. Control chart data must be keypunched into a computer for the data to be available for other types of analysis. A data collector stores data in computer-readable format right at the process.
Trend Alerts
A data collector spots trends in out-of-control processes, and some data collectors will display a warning signal when a trend occurs. Trends can be identified by entering limits into the data collector, which will trigger a trend analysis or warning signal when limits are exceeded. When the system displays a trend-alert message, the operator is asked to enter an assignable cause before data collection can continue.
Math and TIR
Some data collectors have math capabilities for addition, subtraction, multiplication, division, and functions such as minimum, maximum, and range of several inputs. The math is performed on gauge inputs, existing readings, and constants.
An example of this would be finding the weight of a liquid in a container. It can be weighed dry and then filled. The data collector will subtract the dry weight from the filled weight automatically, and plot a control chart on the weight of the liquid.
The range function can be used to find the difference between the highest and lowest of several inputs. An example would be checking the flatness of a surface along several points, performed by placing the part in a fixture that has several column gauge indicators or LVDT probes. The data collector will read all the inputs, calculate the range, and plot range on a control chart.
Total indicator reading (TIR) capability allows a data collector to calculate minimum, maximum or difference from a series of readings taken with one gauge. An example of this would be to check roundness with a bore gauge, where the gauge is inserted and rotated in the bore. The data collector finds and calculates the difference between maximum and minimum, and plots the result on a control chart.
Auditing and Inspection
An appropriate data collector can automate two other areas where data collection and reporting are important:
- Auditing, where the person doing the data collection and analysis is not the machine operator.
- Inspection, which can take place in receiving, production, repair, inventory or final shipping
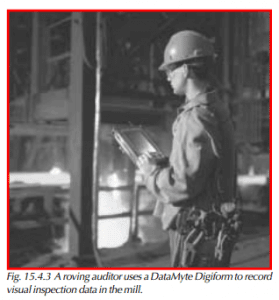
Auditing is performed with handheld or roving data collectors such as the DataMyte 3053 or 501. Typical applications include roving SPC audits, torque verification, inspection, process capability studies, supplier certification, and design of experiments.
A data collector can be used to audit sequential operations, perform tasks on moving assembly lines, and do periodic capability studies and quality checks. Some data collector models can be assigned to a continuous, daily route preprogrammed by a computer, or can be used to randomly log defects and other attributes whenever and wherever found. A data collector summarizes and presents data on a built-in liquid crystal display (LCD) screen, or on a monitor.
Collecting Attribute Data
Many properties of a product or process are such that you can’t easily measure them, but you can plainly see them. These properties include such things as scratches, dents, assembly errors, packaging errors, and improper operation. Properties such as these are called attributes.
Almost all companies do visual inspection of one sort or another. Automating data collection for visual inspection accomplishes three things:
- It supports better problem-solving by production people, inspectors, and managers.
- It provides documentation of inspection in a readable form for management and customers.
- It supports the transition to quality control methods based on prevention, by pointing the way to key areas that require SPC or corrective action.