What are the Characteristics of Measuring Instruments
There are several terms often used when referring to characteristics of measuring instruments: resolution, accuracy, and precision. These terms describe how sensitive instruments are to measured quantities, how bias affects the measurements, and how repeatable an instrument is when measuring.
Resolution
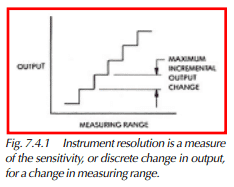
Resolution is the measure to which an instrument can sense the variation of a quantity to be measured. It is the maximum incremental change in the instrument’s output with a change in any specified portion of its measuring range. Figure 7.4.1 shows that there is a discrete change in output for a large enough change in the input measuring range.
Accuracy
Accuracy is the condition or quality of conforming exactly to a standard. The accuracy of an instrument is the extent to which the average of many measurements made by the instrument agrees with the true value or standard being measured. The difference between the average and the true value is the error, or inaccuracy. A lack of accuracy is sometimes referred to as bias. When this condition is a result of the measuring instrument, it is known as out of calibration.
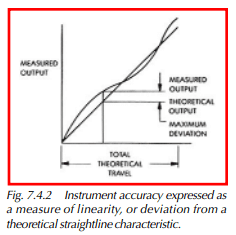
A measuring instrument’s accuracy must be considered over the whole range of the measuring instrument. This is often expressed as linearity. Linearity is the maximum deviation of the actual measurements from a defined theoretical straight line characteristic. It is expressed as a percentage of the theoretical output and measured output over the total theoretical output characteristic. The ratio can be expressed as follows:
![]()
where: θ is the theoretical output
E is the measured output
θT is the total theoretical output
Often the linearity of an instrument is expressed in terms of nonlinearity (1 – linearity ratio). Nonlinearity can be expressed as a percentage of deviation from the theoretical output and measured output over the total theoretical output.
![]()
Figure 7.4.2 illustrates graphically the concept of linearity.
Precision
Precision (also known as repeatability) is the variation in readings obtained when repeating exactly the same measurement. The precision of an instrument is the ability to repeat a series of measurements on the same piece and obtain the same results for each measured value. The variation in measured values can be expressed in terms of a standard deviation of the measuring error. The smaller the standard deviation, the more precise the instrument.
Accuracy Versus Precision
Confusion often exists between the terms accuracy and precision. The confusion exists because the terms are often interchanged in their usage. Accuracy and precision are two different concepts. The accuracy of an instrument can be improved by recalibrating to reduce its error, but recalibration generally does not improve the instrument’s precision. The difference between the two terms will be further clarified in the following examples.
Figure 7.4.3 represents a set of 28 measurements made with the same instrument on the same part, and shows good accuracy with little precision. The accuracy is represented by the small difference (error) between the true value of 0.110 and the average of the measurements of 0.111, which is 0.001. The precision in this case is poor because of the wide distribution of measurements (ranging from 0.107 to 0.115), as shown by the bar graph (each box represents a measurement). This variation can be expressed in terms of a large standard deviation of the measurements error.
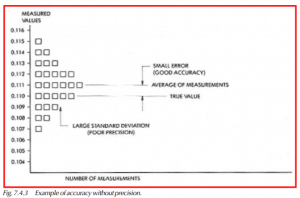
Figure 7.4.4 shows 28 measurements taken with a different instrument on the same part, as in Figure 7.4.3. It shows that there is precision, or good repeatability, but that the accuracy is poor. The precision can be seen in the diagram by noting that the distribution of the measurements (ranging from 0.114 to 0.116) is closely grouped around the average (0.115) of the measurements. The standard deviation of the measurements is small in this case. The large error between the true value (0.110) and the average (0.115) of the measurements is 0.005 and represents poor accuracy.
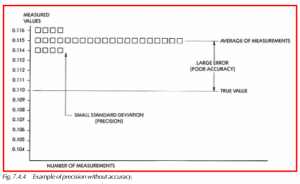
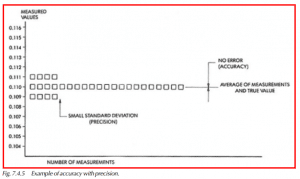
Figure 7.4.5 shows 28 measurements taken with a different instrument on the same part, as in the two previous examples. It shows that the precision, or repeatability, is good, as is the accuracy. Figure 7.4.5 shows that the true value (0.110) and the average value of the measurements (0.110) are the same, indicating that the accuracy is very good. It can also be noted that the variation of the measurements is quite small (ranging from 0.109 to 0.111), which indicates precision or good repeatability.
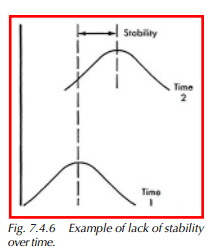
Stability
Stability refers to the difference in the average of at least two sets of measurements obtained with the same measuring device on the same parts taken at different times. See Figure 7.4.6.