What is a u-CHART
The u-chart is appropriate in the same situations as the c-chart. The differences are in the calculation of control limits and that the plotted points represent the average number of nonconformities per unit, instead of just the number of nonconformities. A u-chart must be used instead of a c-chart if the unit size of a subgroup varies from subgroup to subgroup.
The following symbols are used on a u-chart:
n — The number of units in a subgroup (the subgroup, sample, or subset size).
k — The number of subgroups in the current calculation.
c — The number of defects or nonconformities found in a subgroup.
u — The average number of defects or nonconformities per unit in a subgroup.
These are the points that are plotted on the chart. The formula is:
![]()
u-bar — The grand average number of defects or nonconformities per unit for the study period. This is drawn as the centerline on the chart. It is found by dividing the total number of defects found in all subgroups of the study period by the total number of units inspected in the study period. The formula is:
![]()
How to Make and Use a u-Chart
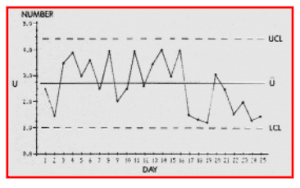
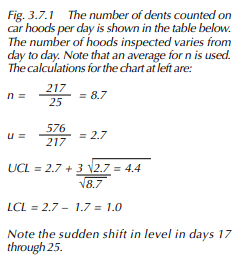
Refer to the example in Figure 3.7.1.
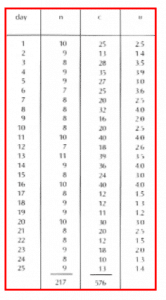
1) Gather and record the data.
2) Calculate u-bar.
