Glossary “S” Definition of Terms in DataMyte
S
Symbol for the standard deviation of a sample.
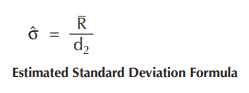
σˆ
Symbol for the estimated standard deviation given by the formula. The estimated standard deviation may only be used if the data is distributed normally and the process is in control.
Sample (statistics)
A representative group selected from a population. The sample is used to determine the properties of the population.
Sample Size
The number of elements, or units, in a sample.
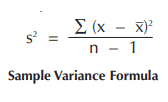
Sample Variance
The variance of a sample number of observations.
Sampling
The process of selecting a sample of a population and determining its properties. The sample is chosen in such a way that its properties are representative of the population.
Sampling Variation
The variation of a sample’s properties from those of the population from which it was drawn.
Scatter Diagram
For a set of measurements of two variables on each unit of a group: a plot on which each unit is represented as a dot at the x,y position corresponding to the measured values for the unit. The scatter plot is a useful tool for investigating the relationship between the two variables.
Sensitivity (of a measuring instrument)
The smallest change in the measured quantity which the instrument is capable of detecting.
Shewhart Control Chart
A graphic continuous test of hypothesis. Commonly known as x and R charts. See also Control Chart, x and R Chart, and x and Sigma Charts.
Short-run SPC
A set of techniques used for SPC in low-volume, short-duration manufacturing.
SI System
The metric system of units of measure. The basic units of the system are the meter, the kilogram, and the second; the system is sometimes called the MKS system for this reason.
Sigma
The standard deviation of a statistical population, symbolized by the Greek letter σ.
Sigma Limits
For histograms: lines marked on the histogram show the points n standard deviations above and below the mean.
Simulation (modeling)
Using a mathematical model of a system or process to predict the performance of the real system. The model consists of a set of equations or logic rules that operates on numerical values representing the operating parameters of the system. The result of the equations is a prediction of the system’s output.
Skewness
A measure of a distribution’s symmetry. A skewed distribution has a longer than normal tail on its right or left side.
Specification (of a product)
A list of the required properties of a product. The specifications may include the desired mean and/or tolerances for certain dimensions or other measurements, the color or texture of surface finish, or any other properties that define the product.
Stability (of a process)
A process is said to be stable if it shows no recognizable pattern of change. See also Control and Constant-Cause System.
Standard (measurement)
A reference item providing a known value of a quantity to be measured. Standards may be primary — i.e., the standard essentially defines the unit of measure — or secondary (transfer) standards, which have been compared to the primary standard (directly or by way of an intermediate transfer standard). Standards are used to calibrate instruments that are then employed to make routine measurements.
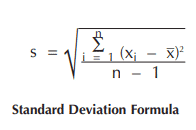
Standard Deviation
A measure of the variation among the members of a statistical sample. If a sample of n values has a mean of x, its standard deviation is given by the formula.
Statistic
An estimate of a population parameter using a value calculated from a random sample.
Statistical Control (of a process)
A process is said to be in a state of statistical control when it exhibits only random variations.
Statistical Inference
The process of drawing conclusions on the basis of statistics.
Statistical Process Control (SPC)
Statistical methods for analyzing and controlling the variation of a process.
Statistical Quality Control (SQC)
The application of statistical methods for measuring and improving the quality of processes. SPC is one method included in SQC.
Stratification (of a sample)
If a sample is formed by combining units from several lots having different properties, the sample distribution will show a concentration or clumping about the mean value for each lot: this is called stratification. In control charting, if there are changes between subgroups due to stratification, the R chart points will all tend to be near the centerline.
Subgroup
For control charts: a sample of units from a given process, all taken at or near the same time.
Systematic Variation (of a process)
Variations which exhibit a predictable pattern. The pattern may be cyclic (i.e., a recurring pattern) or may progress linearly (trend).
