What are the Tests of Normality for Non-normal Distributions
There are several well-known tests to determine if a set of data differs significantly from the normal distribution:
- Skewness – Determining if the symmetry of the data is significantly different from the normal distribution. Sample sizes greater than 25.
- Kurtosis – Testing whether the shape differs from the normal in relation to the thickness of the distribution’s “tails.” Sample sizes greater than 25.
- Chi-Square – Comparison of theoretical to actual frequencies. For large sample sizes, minimum of 50 data values.
- Shapiro-Wilk – A non-parametric test. Sensitive to departures from normality for small sample sizes (10..50)
Skewness
Given a set of data, there are certain quantities called moments about the mean. The Kth moment is defined as follows:
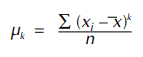
The first moment about the mean is necessarily equal to zero. The second moment, adjusting (n) to (n–1) for bias, equals the variance. The third moment, µ3, is used in the calculation of the most commonly used skewness statistic, γ1.
Stepwise,
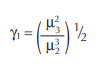
- Calculate the 3rd moment, (keeping track of the sign).
- Calculate the 2nd moment.
- Divide the square of the 3rd moment by the cube of the 2nd moment.
- The skewness statistic equals the square root of the result from Step 3, using the sign of the 3rd moment from Step 1.
The sign of the test statistic indicates the direction of the skewness. Hypothesis testing regarding the skewness statistic involves comparing the statistic to a critical value. The critical value is contingent upon the sample size and probability level of the test (alpha = .01, .05, …).
The hypothesis of normality is rejected if the test statistic is greater than the critical value.
Kurtosis
Similar to the calculations for the skewness statistic, moments about the mean are required to determine the kurtosis statistic, γ2
Stepwise,
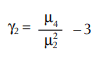
- Calculate the 4th moment.
- Calculate the 2nd moment.
- Divide the 4th moment by the square of the 2nd moment.
- The kurtosis statistic equals the result from Step 3, minus 3.0.
Again, similar to skewness testing, the value statistic is compared to a table of critical values. The hypothesis of normality is rejected if the test statistic is greater than the critical values.
Shapiro-Wilk W-Test
(Shapiro, S.S., and Wilk, M.B., Biometrika 52:591 (1965).)
This is an excellent, simple non-parametric test, well-suited for small sample sizes. Non-parametric means that the mean and standard deviation do not have to be supplied.
Tables of coefficients are required to calculate the W statistic.
Calculation
- Sort the data, smallest to largest (x1, x2, …….xn)
- Determine ∑ (xi – x) 2
- If n is even, then k = n/2 Otherwise, k = (n–1) /2
- b = ∑k i=1 an–i+1 (xn–i+1 – xi )
- W = b2 / ∑ (xi – x) 2 6. Reject hypothesis of normality if W is less than tabular value of alpha and sample size.
Chi-Square Test
The most commonly used method of testing for normality is the χ2 test of goodness of fit. The χ2 test compares sample frequencies with theoretical frequencies. Differences between the two are squared and summed. The final summation is an χ2 statistic, which is then compared to a table of critical values. The hypothesis of normality is rejected if the test statistic is greater than the tabular value at the desired alpha level.
The Chi-Square test is described in greater detail on page 5-13.
