Glossary “C” Definition of Terms in DataMyte
c-Chart
For attribute data: A control chart of the number of defects found in a subgroup of fixed size. The c-chart is used where each unit typically has a number of defects.
Calibration (of instrument)
Adjusting an instrument using a reference standard to a higher, more accurate standard to reduce the difference between the average reading of the instrument and the true value of the standard being measured, thereby reducing measurement bias.
Camp-Meidell Conditions
For frequency distribution and histograms: A distribution is said to meet Camp-Meidell conditions if its mean and mode are equal and the frequency declines continuously on either side of the mode.
Capability (of process)
The uniformity of product which a process is capable of producing. Can be expressed numerically using CP, CR, CpK, and Zmax/3 when the data is normally distributed.
Cause and Effect Diagram
A pictorial diagram showing all the cause (process inputs) and effect (resulting problem being investigated) relationships among the factors which affect the process.
Cell (of frequency distribution and/or histogram)
For a sample based on a continuous variable, a cell is an interval into which individual data points are grouped. The full range of the variable is usually broken into intervals of equal size and the number of points in each cell totalled. These intervals (cells) make up a frequency distribution or histogram. This greatly reduces the amount of information which must be dealt with, as opposed to treating each element (data point) individually.
Centerline
For control charts: the horizontal line marking the center of the chart, usually indicating the grand average of the quantity being charted.
Central Limit Theorem
This theorem allows one to assume normal distribution when dealing with x. The averages of different-sized subgroups will follow the normal distribution curve when a reasonably large sample size is used. If means of samples are not normally distributed, increase sample size.
Central Tendency
A measure of the point about which a group of values is clustered; some measures of central tendency are mean, mode, and median. See Central Tendency.
Characteristic
A dimension or parameter of a part that can be measured and monitored for control and capability.
Check Sheet
A sheet for recording data on a process or its product. The check sheet is designed to remind the user to record each piece of information required for a particular study, and to reduce the likelihood of errors in recording data. The data from the check sheet can be typed into a computer for analysis when the data collection is complete.
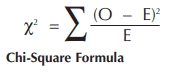
Chi-square (χ2 )
As used for goodness-of-fit: a measure of how well a set of data fits a proposed distribution, such as the normal distribution. The data is placed into classes and the observed frequency (O) is compared to the expected frequency (E) for each class of the proposed distribution. The result for each class is added to obtain a chi-square value. This is compared to a critical chi-square value from a standard table for a given α (alpha) risk and degrees of freedom. If the calculated value is smaller than the critical value, we can conclude that the data follows the proposed distribution at the chosen level of significance.
Chronic Condition
A long-standing adverse condition that requires resolution by changing the status quo.
Cluster
For control charts: a group of points with similar properties. Usually an indication of short duration, assignable causes.
Common Causes
Those sources of variability in a process which are truly random, i.e., inherent in the process itself.
Concerns
The number of defects (nonconformities) found in a group of samples in question.
Confidence coefficent; confidence level
The value (1 – ∝) of the probability associated with a confidence interval or a statistical coverage interval (1 – ∝ is often expressed as a percentage, e.g. 95%).
Confidence Interval
The range within which a parameter of a population (e.g., mean, standard deviation, etc.) may be expected to fall, on the basis of measurement, with some specified confidence level.
Confidence Limits
The upper and lower boundaries of a confidence interval.
Conformance (of product)
Adherence to some standard of the product’s properties. The term is often used in attribute studies of product quality, i.e., a given unit of the product either conforms to the standard or does not.
Constant-Cause System
A system or process in which the variations are random and are constant in time. See also Control and Stability.
Consumer’s Risk
The maximum probability that a bad lot will be accepted by the sampling plan. See also β Risk.
Continuous Data
Data for a continuous variable (variables data). The resolution of the value is only dependent on the measurement system used.
Continuous Variable
A variable that can assume any of a range of values; an example would be the measured size of a part.
Control (of process)
A process is said to be in a state of statistical control if the process exhibits only random variations (as opposed to systematic variations and/or variations with known sources). When monitoring control with control charts, a state of control is exhibited when all points remain between set control limits. See also Stability and Constant-Cause System.
Control Chart
A plot of some parameter of process performance, usually determined by regular sampling of the product, as a function (usually) of time or unit number or other chronological variables. The control limits are also plotted for comparison. The parameter plotted may be the mean value of a particular measurement for a product sample of specified size (x chart), the range of values in the sample (R chart), the percent of defective units in the sample (p-chart), etc. See also Shewart Control Chart, x and R Charts, and x and Sigma Charts.
Control Group
An experimental group that is not given the treatment under study. The experimental group that is given the treatment is compared to the control group to ensure any changes are due to the treatment applied.
Control Limits
The limits within which the product of a process is expected (or required) to remain. If the process leaves the limits, it is said to be out of control. This is a signal that action should be taken to identify the cause and eliminate it if possible. Note: control limits are not the same as tolerance limits.
Correlation Coefficient
Calculated for the purpose of measuring the strength of the relationship between two variables.
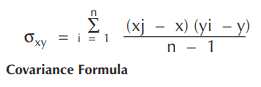
Covariance
A measure of whether two variables (x and y) are related (correlated). It is given by the formula. “n” is the number of elements in the sample.
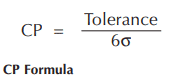
CP
For process capability studies: CP is a capability index defined by the formula. CP shows the process capability potential but does not consider how centered the process is. CP may range in value from 0 to infinity, with a large value indicating greater potential capability. A value of 1.33 or greater is usually desired.
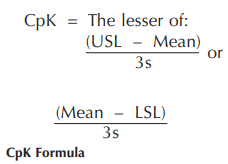
CpK
For process capability studies: an index combining CP and K to indicate whether the process will produce units within the tolerance limits. CpK has a value equal to CP if the process is centered on the nominal; if CpK is negative, the process mean is outside the specification limits; if CpK is between 0 and 1, then some of the 6 sigma spread falls outside the tolerance limits. If CpK is larger than 1, the 6 sigma spread is completely within the tolerance limits. A value of 1.33 or greater is usually desired. Also known as Zmin/3.
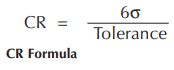
CR
For process capability studies: the inverse of CP, CR can range from 0 to infinity in value, with a smaller value indicating a more capable process.
Cumulative Sum Chart (CuSum)
A cumulative sum chart plots the cumulative deviation of each subgroup’s average from the nominal value. If the process consistently produces parts near the nominal, the CuSum chart shows a line which is essentially horizontal. If the process begins to shift, the line will show an upward or downward trend. The CuSum chart is sensitive to small shifts in process level.
Cycle
A recurring pattern.
